OneRoom's Admin website offers powerful analytics tools for digging into viewer data
If you have an account for our Admin website, you will be able to access in-depth statistics on any venue linked to your account, and any individual services at those venues.
How do I access analytics?
To access analytical data for your venue(s), click the 'Analytics' button within the column of options on the left side of the Admin website.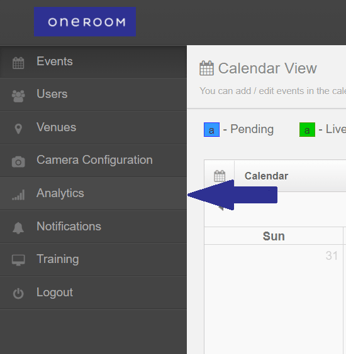
This will lead you to the main Analytics overview page, seen below. By default, the data will cover all of the current month.
Tip: You can extend the date range back by adjusting the date in the filter at the top of the page.
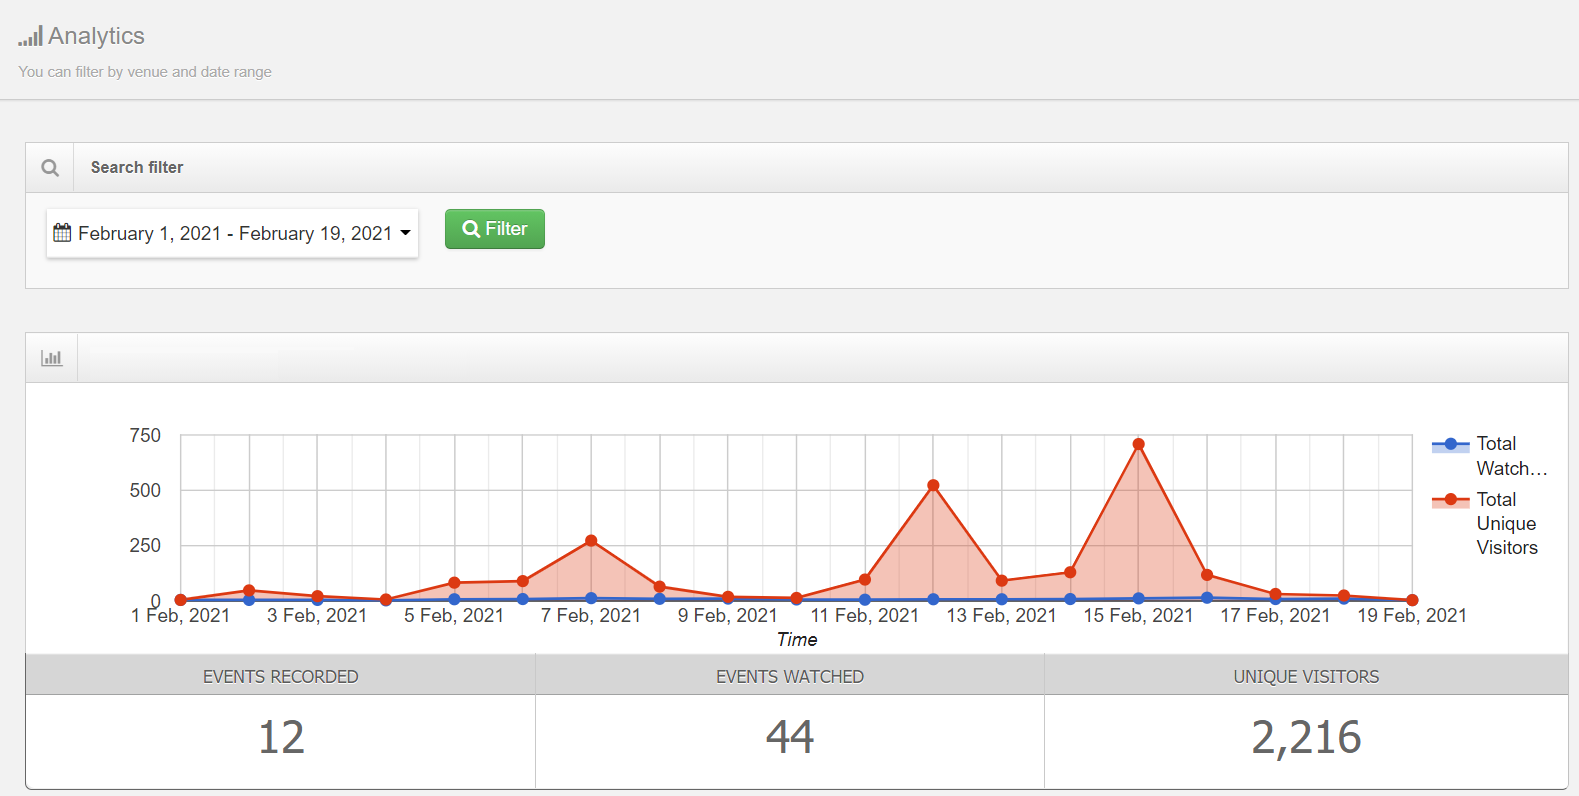
You will see a line graph representing the total unique visitors by day, along with the total Watched services. Below that are the total figures for each category.
- Events Recorded refers to the amount of services streamed/recorded during the current date range selected
- Events Watched refers to the total amount of services - recorded at any time - that have been watched during the current month. I.e., if you are currently searching for analytics for February, 'Events Watched' will count any service that was watched during February even if it was recorded/streamed a year earlier.
- Unique Visitors refers to the total amount of viewers that have logged in to view a service during the current date range selected. If a viewer logs in to view a service twice, they will only count as one 'Unique Visitor' (assuming they logged in using the same device/PC each time)
How do I see where viewers watched from?
Scrolling further down the analytics page, you will see more data including:
- a world map of countries viewers came from
- a list of cities/locations where those viewers are from, and how many viewers came from those cities.
Tip: Hovering your mouse over a country on the world map will show you how many viewers came from that country in total.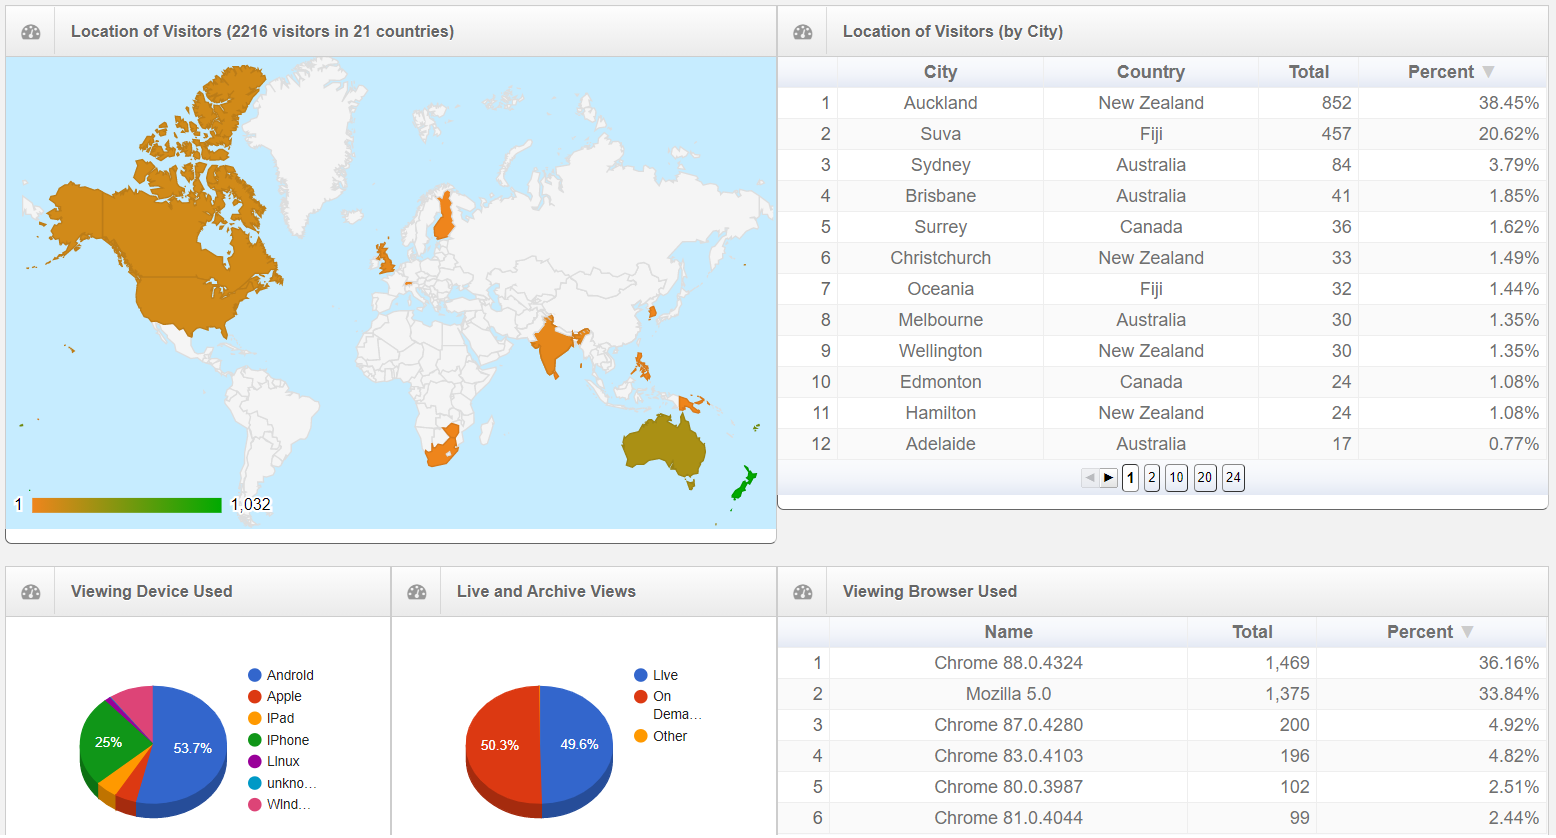
Below the map, you will see more information including:
- a pie chart showing what kinds of devices were used to view with
- another pie chart showing how many people watched services live vs. later (on demand)
- a list of internet browsers used when accessing a stream
Accessing analytics for a specific service
Scrolling further down to the bottom of the page Analytics page, you will get to a list of services by name (names are blurred in this example). This gives you an overview of the analytics boiled down to a service-by-service basis rather than the venue overall.
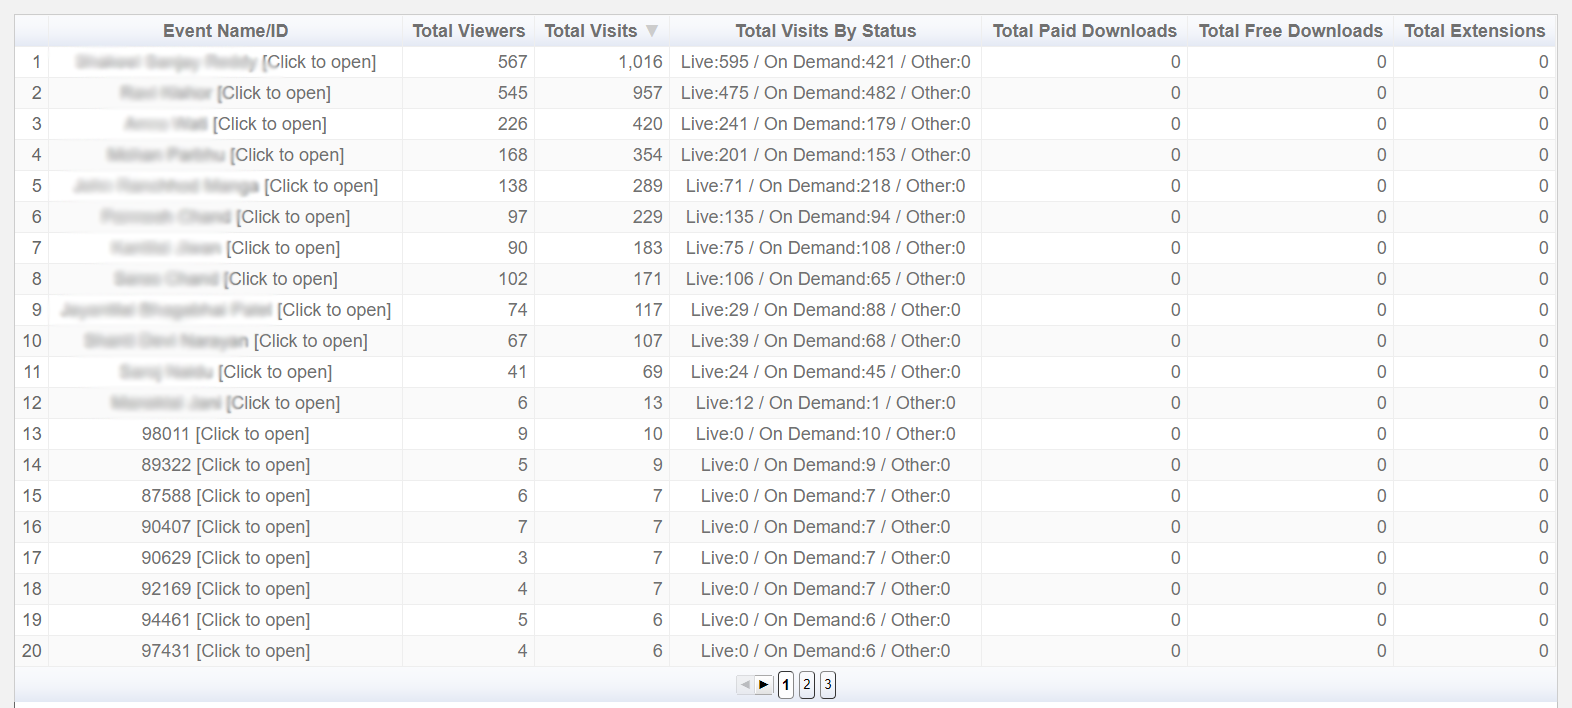
- Total Viewers refers to the the total unique persons that logged in to watch the service
- Total Visits refers to the amount of times people logged in, i.e. one person could log in multiple times and each time it will be added to the 'Total Visits' count
- Total Paid Downloads refers to the amount of people that purchased a copy of the service via OneRoom
Clicking on any service in the list will take you to that services' overview page.
Scrolling down a services overview page, you'll see similar statistical data as shown throughout this article (world map, devices used, etc.), but specifically for the service in question rather than the venue overall.
Tip: In the example above, notice how services from number 13 onwards are titled by a number rather than the name of deceased - these services are ones that were recorded prior to the current search filter date settings.
Services 1-12 were recorded during the current search month, whereas 13-onwards were recorded prior. They are still added to the list as their statistics (Total Viewers, Total Visits, etc.) are from viewers who logged in during the current search month.